SD Hands Free

Institution-level automated futures trading.
Without watching a single chart.

High Risk · Live

Account Statement

Lightning Funded / $150,000
Sim · Apr 1 – Jun 18
Upfront cost (funding fee)$517.00
Raw combined gains+$35,582.37
Counted profit (after cap)$19,558.52
Cash payouts withdrawn$5,400.00
Net realized cash+$4,883.00
10yrs
building automation
5
algorithmic models
0
drawdown breaches
Why Hands Free

Built for traders who are tired of guessing.

Most people do not fail at trading because of bad ideas. They fail because of inconsistent execution, emotional overrides, and time they do not have. This engine was designed to solve those problems directly.

Reclaim your time

No charts, no alerts, no midnight position checks. The engine runs on a dedicated server around the clock so you can stop babysitting the market.

Remove the emotion

Discretionary traders often second-guess entries, chase losses, or size up at the wrong moment. Automation executes the plan exactly as written.

Five models, one engine

Five independent algorithmic models trade together under a single risk layer. Diversification is built in, not an afterthought.

Hard risk guardrails

Daily profit caps, trailing drawdown locks, and coordinated sizing limits are enforced automatically — no willpower required.

Real payouts documented

The track record includes actual milestone withdrawals, not just theoretical equity. You can see what came back out of the account.

Connected performance

The account is live and connected, so you can see real milestones, withdrawals, and equity movement — not hypothetical backtests or simulated curves.

Documented Run

The Track Record · Apr 1 to Jun 18

What the engine pulled off on a $150,000 funded simulation. Running at the High Risk setting, here is exactly how the documented run broke down, from the single upfront fee to the cash that came back out.

Upfront cost
$517

A single funding fee to open the account, the only cost going in.

Raw combined gains
$35,582.37

Total system profit across all models before the daily cap is applied.

Counted profit
$19,558.52

What remained after a strict $1,800 daily profit cap held the number back.

Cash payouts
$5,400.00

Pulled out across two milestone payouts of $2,700 each. Real cash in hand.

Net realized cash
$4,883.00

What was left after covering the original $517 funding fee.

Risk control
0 breaches

$13,558.52 in unwithdrawn profit still cushioning the account above its trailing threshold.

The Architecture

Not one bot. A coordinated system.

The engine orchestrates and scales multiple advanced algorithmic models at the same time, so the equity curve stays smooth and no single strategy carries the account.

Strategy performance
Hypothetical results · figures as labeled per strategy · swipe to explore
Strategy 1
since Dec 2025
Hypothetical · cumulative
+48.5%
Max drawdown
≈ −$2,875
Profit factor
1.4
Win rate
49.1%
Sharpe ratio
2.52
Trades
804
Strategy 2
since Apr 2026
Hypothetical · cumulative
+7.3%
Max drawdown
≈ −$7,250
Profit factor
1.2
Win rate
64.3%
Sharpe ratio
0.82
Trades
42
Strategy 3
since Mar 2026
Hypothetical · cumulative
+21.7%
Max drawdown
≈ −$19,860
Profit factor
1.2
Win rate
46.2%
Sharpe ratio
1.44
Trades
184
Strategy 4
since Mar 2026
Hypothetical · cumulative
+103.1%
Max drawdown
≈ −$2,925
Profit factor
1.9
Win rate
60.6%
Sharpe ratio
4.02
Trades
218
Strategy 5
since Sept 2020
Hypothetical · annual (compounded)
+35.4%/ yr
Max drawdown
≈ −$12,690
Profit factor
1.6
Win rate
36.1%
Sharpe ratio
1.59
Trades
728
Strategy 5 — yearly returns (hypothetical)
2020 +13.3%2021 +17.8%2022 +76.4%2023 +17.8%2024 +70.1%2025 +5.0%2026 YTD +17.8%

Hypothetical performance. Figures were not achieved by any actual account and have inherent limitations; they do not reflect actual trading. Strategies 1–4 show cumulative returns since each inception date shown (periods under one year — not annualized). Strategy 5 shows a compounded annual return over roughly six years. Drawdown dollar amounts are approximate, derived from each strategy's suggested minimum capital. No representation is made that any account will achieve similar results. Trading futures involves substantial risk of loss. Past performance is not indicative of future results.

Risk Profiles

One engine, tuned to your appetite.

You pick the risk profile and the engine scales sizing, exposure, and pacing to match it. The track record above reflects the High Risk configuration in full.

Low Risk

Conservative sizing and tighter exposure built for capital preservation and a calmer ride for traders who want steady, drawdown-aware growth.

Medium Risk

A balanced gear that pursues meaningful returns while keeping exposure measured and controlled. The setting most operators end up choosing.

Shown above
High Risk

Maximum scaling across all five models for traders chasing the steepest curve. The exact configuration behind the documented run.

Emil Adides · The Operator Behind It

Meet Emil Adides

Emil has spent the last ten years designing, testing, and running automated trading systems, long before "set it and forget it" became a marketing phrase.

His flagship application coordinates five algorithmic models into a single risk-managed engine. From the underlying entry logic to the trailing drawdown lock mechanics, every layer is written down and fully documented.

The April-through-June run is the latest proof of a simple thesis: disciplined automation, scaled correctly, beats discretionary screen time over the long haul.
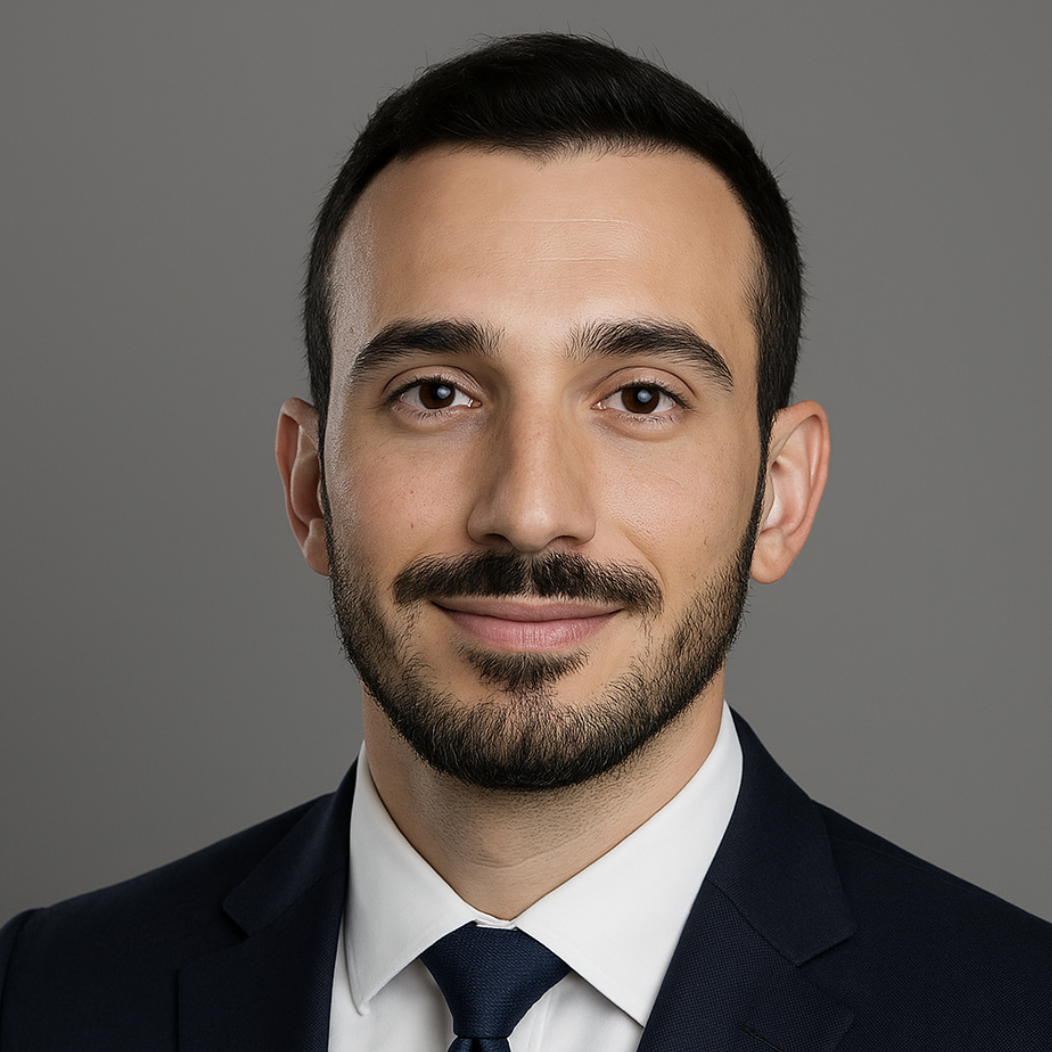
Emil Adides
Systems built
5 models · 1 engine
Since
2016
Strict Capacity Limit

Only a few spots are open for this run.

To protect execution speed, server stability, and strict risk management, capacity on each run is hard-capped. We are taking a small number of select accounts and no more.

Spots remaining this run: limited · applications reviewed in the order they arrive
Questions

Before you claim a spot.